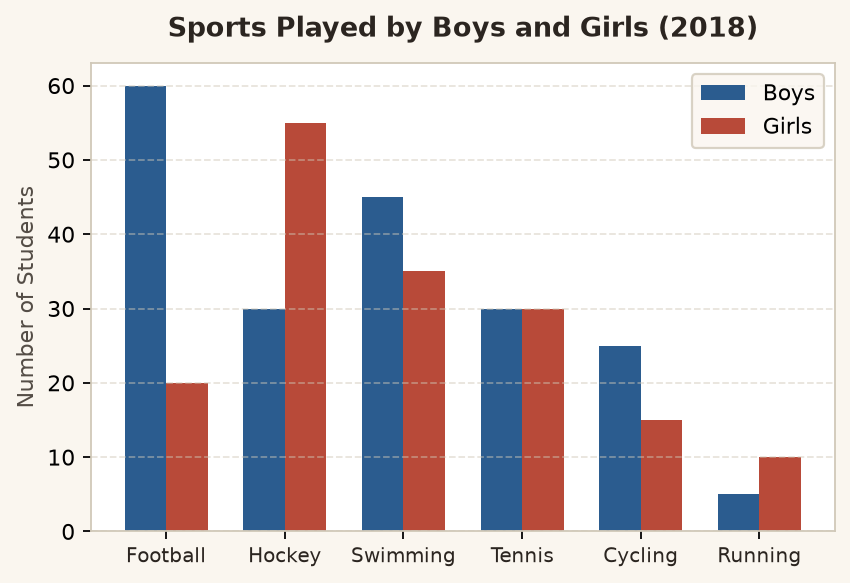
Sports Played by Boys and Girls (IB School)
Number of students participating in sports (2018)
Measured in: Number of participants
The bar chart illustrates the sports played by boys and girls at the IB School in 2018.
جملة الافتتاح: تبيّن موضوع الرسم ومكانه وسنته.
Overall, boys at the school are more active in sports than girls, with clear differences in preference between the two groups.
النظرة العامة: الاتجاه العام بدون ذكر أي أرقام.
The most popular sport for boys is football, with a total of 60 boys participating.
تفضيل الأعلى: رقم كرة القدم للأولاد.
For girls, hockey is by far the most popular choice, chosen by 55 female students.
تفضيل الأعلى للبنات: الهوكي.
Hockey is far more popular with girls than with boys, whereas football shows the complete opposite trend.
مقارنة مباشرة بين الفئتين باستخدام than و whereas.
A similar number of boys and girls play tennis, with exactly 30 participants in each group.
مقارنة تشابه: التساوي بين الفئتين.
Cycling is not as popular as swimming for either boys or girls.
تركيب النفي والتساوي: not as popular as.
The least popular sport overall is running, engaging only 5 boys and 10 girls.
تفضيل الأدنى: الجري.
To summarise, football and hockey divide the genders most clearly, while tennis provides equal interest.
الخاتمة: تلخيص الفكرة الرئيسية بعبارة To summarise.
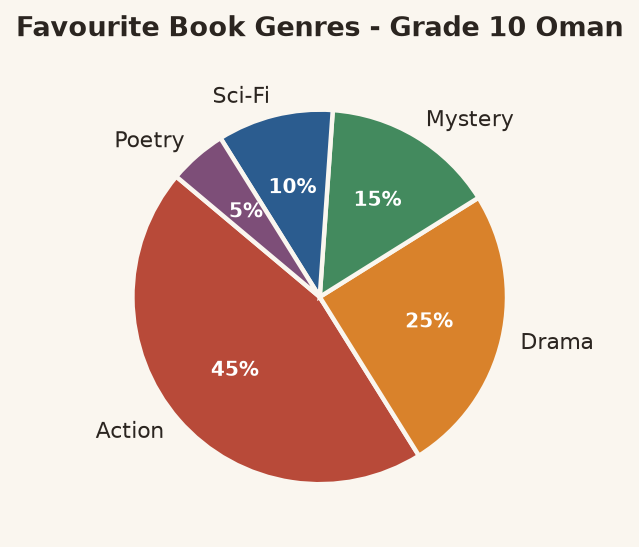
Favourite Book Genres of Grade 10 Students in Oman
Percentage breakdown of reading preferences in Omani schools
Measured in: Percentage of students (%)
The pie chart gives information about the favourite book genres among Grade 10 students in Oman.
جملة الافتتاح: صياغة أنيقة لعنوان الـ pie chart.
Overall, action fiction stands out as the dominant reading preference, while poetry attracts the least interest.
النظرة العامة: تحديد النوع الأقوى والأضعف بلا أرقام.
Action is by far the most popular genre, selected by nearly half the students at 45%.
تفضيل الأعلى: النسبة الأعلى 45%.
Drama is significantly more popular than mystery, accounting for 25% compared with 15%.
مقارنة صريحة مع ذكر النسبتين.
Science fiction is not as popular as mystery, capturing only 10% of student votes.
توظيف not as popular as لدقة المقارنة.
Poetry is the least favoured category of all, chosen by only 5% of Grade 10 learners.
تفضيل الأدنى: الشعر.
To summarise, Omani tenth-graders overwhelmingly prefer exciting genres over classical poetry.
خاتمة استنتاجية موجزة.
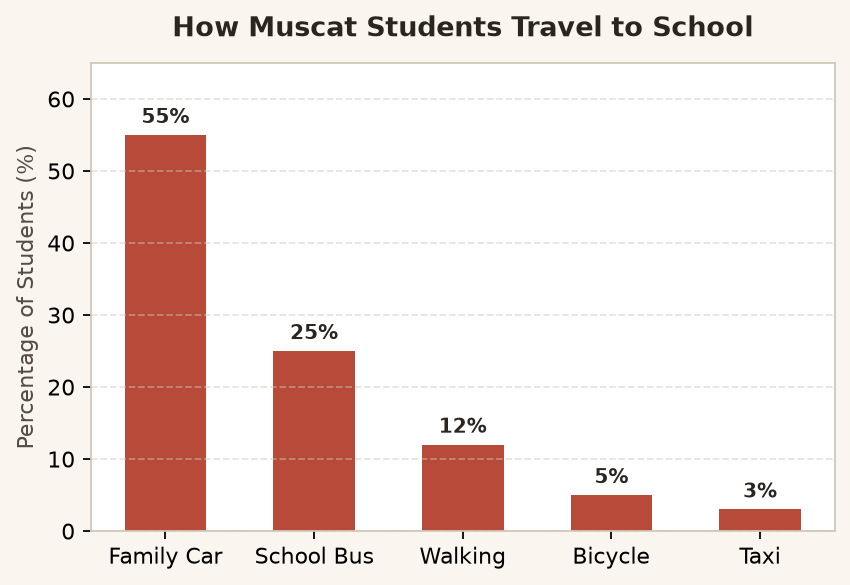
How Students in Muscat Travel to School
Primary mode of transport used by secondary students (2024)
Measured in: Percentage of students (%)
The bar chart compares five different modes of transport used by students in Muscat to reach school.
الافتتاح: بيان وسائل المواصلات الخمس.
Overall, private motor vehicles represent the primary method of travel, whereas active commuting is far less common.
نظرة عامة تقارن بين النقل الآلي والنشط.
The family car is the most common way to travel, used by 55% of all surveyed students.
تفضيل الأعلى مع الرقم: 55%.
The school bus is more widely used than walking, at 25% compared to 12%.
مقارنة واضحة بـ more widely used than.
Cycling is not as common as walking, chosen by only 5% of the pupil population.
استخدام not as common as.
Taxis rank as the least preferred option, accounting for a modest 3%.
تفضيل الأدنى مع الرقم: 3%.
To summarise, the vast majority of Muscat students depend on motorized family vehicles for their daily school commute.
خاتمة تلخص الاعتمادية العالية على السيارات.
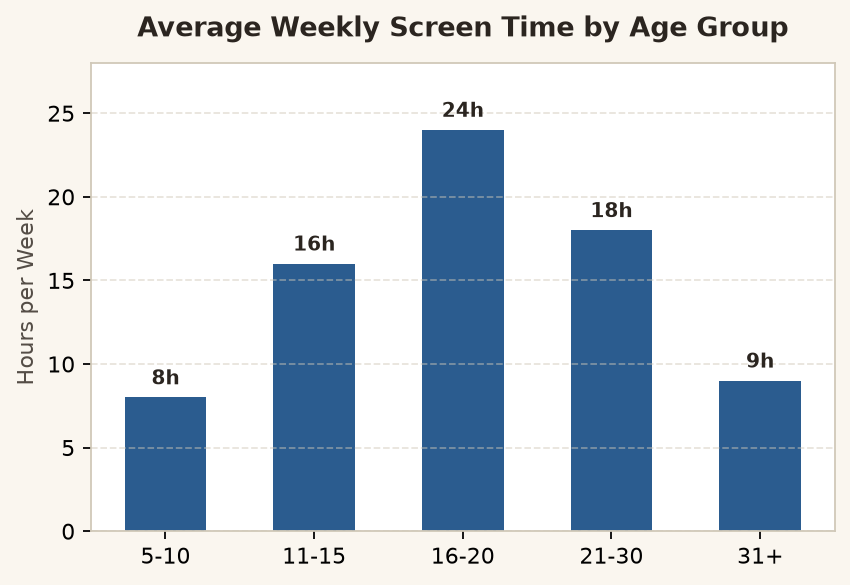
Weekly Screen Time by Age Bracket
Average hours spent per week on smart devices (2024)
Measured in: Hours per week
The bar chart presents the average number of hours per week that various age groups spend looking at screens.
الافتتاح: توضيح الساعات الأسبوعية للفئات العمرية.
Overall, teenagers and young adults record the highest digital exposure, while young children and older adults show much lower figures.
نظرة عامة تقارن نمط الفئات العمرية.
Individuals aged 16 to 20 record the highest screen time, averaging 24 hours every week.
أعلى معدل أسبوعي للفئة 16-20.
Young adults aged 21 to 30 spend more time on screens than adolescents aged 11 to 15.
مقارنة أكثر بـ more time than.
Children aged 5 to 10 are not as attached to screens as older teenagers, logging only 8 hours.
استخدام not as attached as للأطفال.
The lowest digital consumption is seen in children aged 5 to 10 and adults over 31, at around 8 to 9 hours.
أدنى معدل استهلاك.
To summarise, screen addiction peaks sharply during high school and university years before falling in later adulthood.
خاتمة ترصد ذروة الاستخدام ثم انخفاضه.
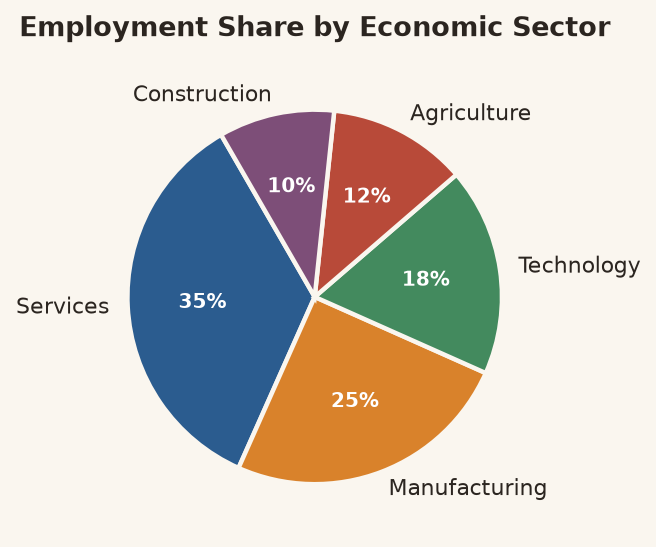
Workforce Distribution Across Economic Sectors
Proportion of workforce employed in key national industries
Measured in: Share of employment (%)
The pie chart illustrates how employment is divided among five major economic sectors.
الافتتاح: توزيع الوظائف على القطاعات.
Overall, the service and manufacturing sectors employ the bulk of the population, leaving traditional industries behind.
نظرة عامة تبيّن سيطرة الخدمات والتصنيع.
The service industry is the largest employer by a wide margin, responsible for 35% of all jobs.
تفضيل الأعلى للخدمات: 35%.
Manufacturing generates more jobs than the technology sector, with 25% compared to 18%.
مقارنة مباشرة بين التصنيع والتقنية.
Agriculture is not as large as technology, employing only 12% of the workforce.
استخدام not as large as للزراعة.
Construction represents the smallest sector shown, accounting for a modest 10%.
تفضيل الأدنى: قطاع الإنشاءات 10%.
To summarise, contemporary employment focuses heavily on service and industrial provisions rather than agriculture.
خاتمة عن توجهات سوق العمل الحديثة.
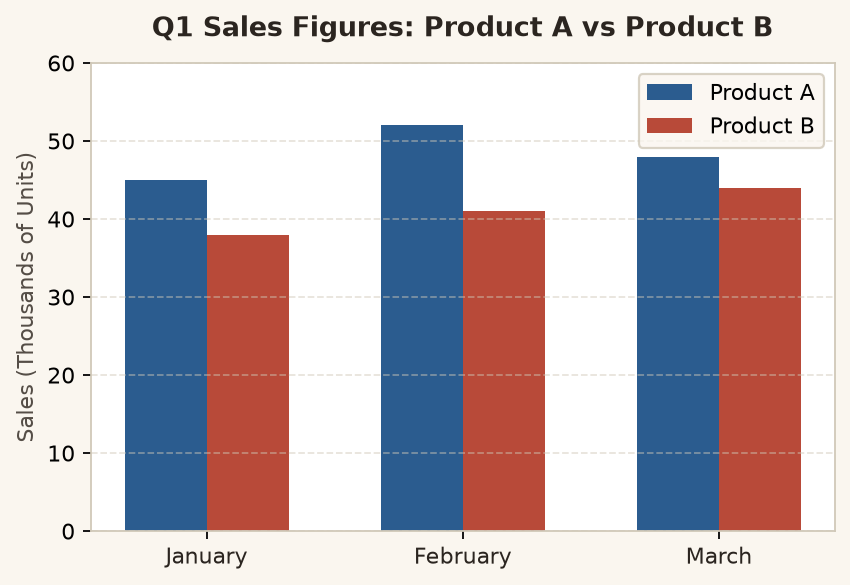
Quarterly Sales Performance: Product A vs Product B
Monthly sales figures during the first quarter (in thousands of units)
Measured in: Sales (thousands)
The bar chart compares the monthly sales figures for Product A and Product B across the first quarter of 2024.
الافتتاح: مقارنة مبيعات المنتجين في الربع الأول.
Overall, Product A consistently maintained higher sales than Product B throughout the entire three-month period.
نظرة عامة تؤكد تفوق المنتج A الدائم.
Product A achieved its peak performance in February, reaching 52,000 units sold.
أعلى رقم حققه المنتج A في فبراير.
Product B displayed steady upward growth each month, rising from 38,000 to 44,000 units.
مقارنة النمو التدريجي للمنتج B.
In January, Product B was not as successful as Product A, lagging behind by 7,000 units.
صيغة not as successful as لشهر يناير.
The lowest sales recorded during the quarter belonged to Product B in January at 38,000 units.
أدنى قيمة في الربع كاملاً.
To summarise, while Product A proved more profitable overall, Product B demonstrated steadier month-on-month improvement.
خاتمة تجمع بين قوة الأول وثبات الثاني.
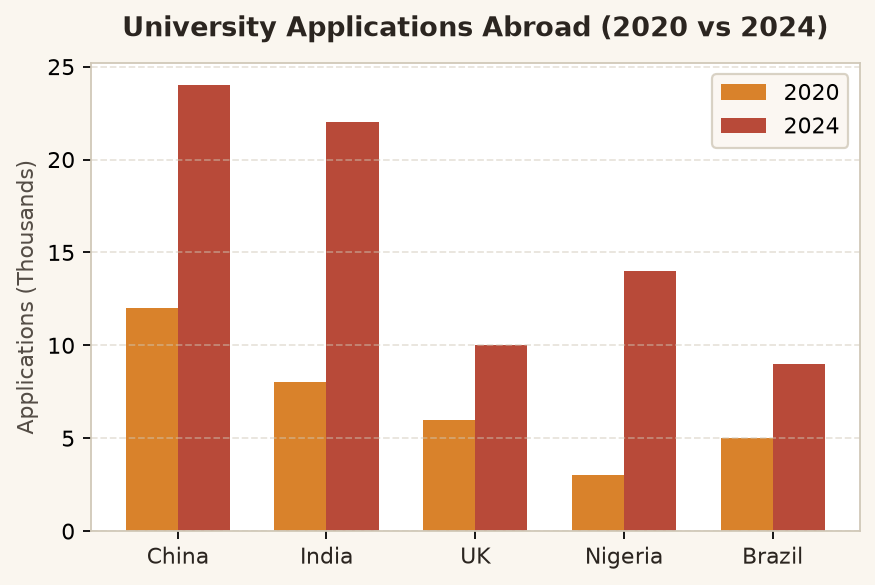
Higher Education Study Abroad Applications
Growth in university applications from five developing nations
Measured in: Applications (thousands)
The bar chart outlines the number of students applying for overseas universities from five nations in 2020 and 2024.
الافتتاح: طلبات الدراسة بالخارج في عامين.
Overall, every nation sent substantially more applicants abroad in 2024 than four years earlier.
نظرة عامة توضح الارتفاع العام لجميع الدول.
China generated the highest volume of overseas applicants in both years, rising from 12,000 to 24,000.
الصدارة للصين مع الأرقام.
Nigeria demonstrated far faster relative growth than the UK, more than quadrupling its initial total.
مقارنة نسبة النمو السريع لنيجيريا مقابل بريطانيا.
Brazil was not as prominent as India, producing less than half of India's 2024 applicant numbers.
صيغة not as prominent as للبرازيل.
In 2020, Nigeria had the lowest initial application rate at only 3,000 students.
أدنى بداية في 2020.
To summarise, Asian nations continue to lead in student volume, while African interest is expanding at the fastest pace.
خاتمة استراتيجية ذكية للمقارنة.
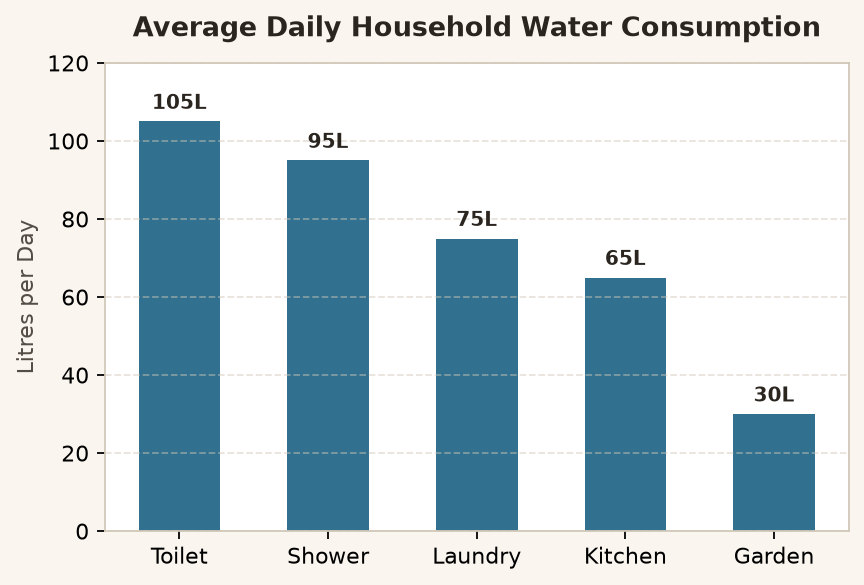
Daily Domestic Water Consumption Patterns
Average litres of water used daily per household by activity
Measured in: Litres per day
The bar chart depicts the average daily quantity of water consumed across five main household activities.
الافتتاح: كميات المياه اليومية في المنازل.
Overall, personal hygiene and sanitation consume the overwhelming majority of home water supplies.
نظرة عامة: النظافة الشخصية هي المستهلك الأكبر.
Toilet flushing is the single greatest consumer of household water, using 105 litres every single day.
أعلى استهلاك بالأرقام: الحمام 105 لتر.
Taking showers requires considerably more water than washing dishes in the kitchen, at 95 litres versus 65 litres.
مقارنة واضحة: الاستحمام أكثر من المطبخ.
Outdoor gardening is not as demanding as laundry, utilizing less than half as much water.
صيغة not as demanding as للحدائق.
Gardening accounts for the lowest daily expenditure, standing at merely 30 litres.
أدنى استهلاك يومي.
To summarise, indoor sanitation and washing represent primary water costs, while outdoor use remains relatively minor.
خاتمة تلخص الفروقات بين الداخل والخارج.
Social Media Platform Market Share Among Teenagers
Preferred social networks among secondary school learners (2024)
Measured in: Active user share (%)
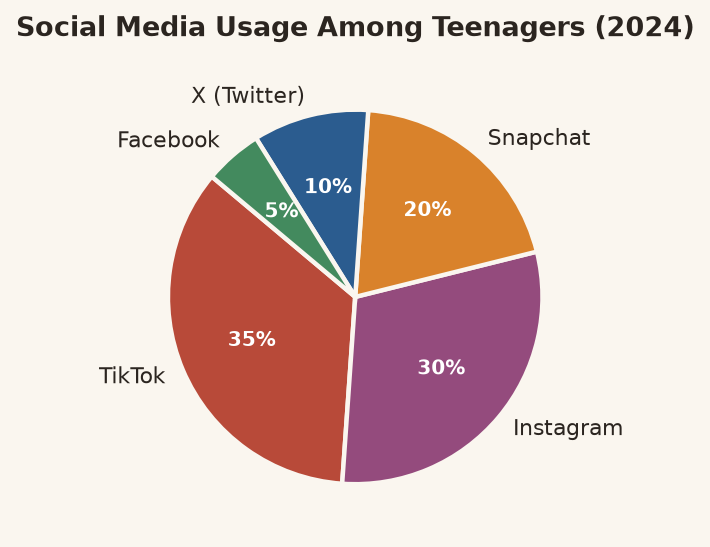
The pie chart categorizes the distribution of young users across five major social networking platforms in 2024.
الافتتاح: توزيع المراهقين على المنصات.
Overall, modern video-centric applications heavily dominate youth engagement, leaving older text networks marginalized.
نظرة عامة: التطبيقات المرئية تكتسح.
TikTok holds the highest popularity among teenagers, commanding 35% of the overall user base.
أعلى نسبة للتيك توك 35%.
Instagram attracts significantly more interest than Snapchat, leading with 30% against 20%.
مقارنة انستغرام بسناب شات.
X (Twitter) is not as appealing as Snapchat to teenage audiences, securing just 10% of users.
صيغة not as appealing as لمنصة إكس.
Facebook proves to be the least favored platform by far, selected by a tiny 5% of adolescents.
أقل منصة تفضيلاً: فيسبوك 5%.
To summarise, younger demographics are prioritizing short-form visual content over traditional communicative media.
خاتمة تربط النتائج بسلوك المراهقين.
Comparative Air Pollution Levels in Major Capital Cities
Air Quality Index (AQI) ratings recorded in 2022 and 2024
Measured in: Air Quality Index (AQI)
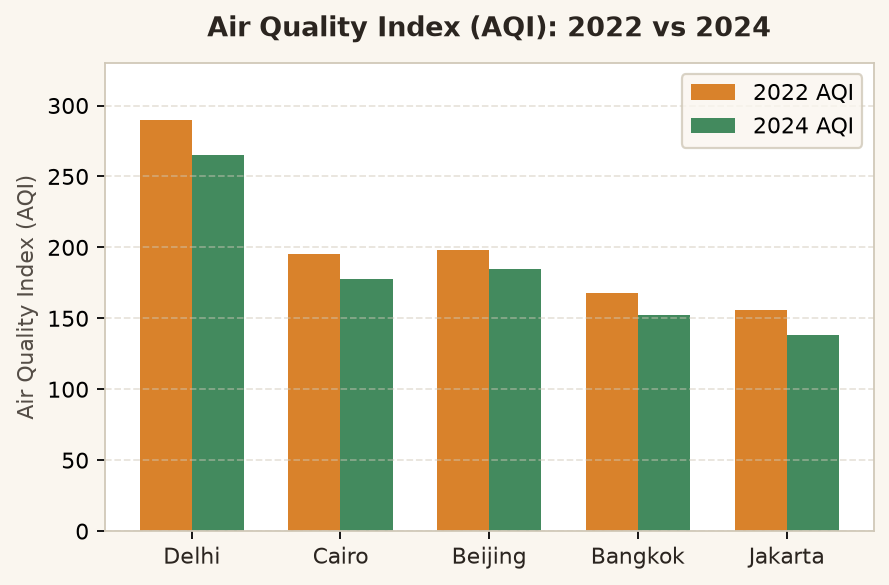
The bar chart compares air pollution severity in five world capitals across two distinct calendar years.
الافتتاح: مقارنة مؤشر التلوث في خمس عواصم.
Overall, atmospheric air quality improved across every single surveyed metropolis over the biennial period.
نظرة عامة: تحسن جودة الهواء في كل المدن بلا استثناء.
Delhi endured the worst environmental conditions by a wide margin, registering index readings of 290 and 265.
أسوأ تلوث بالأرقام في دلهي.
Cairo suffered higher pollution ratings than Bangkok during both assessed years.
مقارنة مستمرة بين القاهرة وبانكوك.
Jakarta's pollution levels were not as dangerous as Beijing's, demonstrating a healthy drop to 138 in 2024.
صيغة not as dangerous as لجاكرتا.
Jakarta recorded the cleanest air ratings among all cities, reaching the lowest index number of 138.
أفضل رقم قياسي (الأدنى تلوثاً).
To summarise, while environmental interventions have successfully lowered pollution globally, regional disparity remains massive.
خاتمة عن الفجوة البيئية بين المدن.